Kudos: Campus Diversity's great job of incorporating infographics
Over the last couple of months, we've been working with the new staff in the Office for Campus Diversity to reorganize and redo most of their site and its content so it better matches their vision for the office and the University.
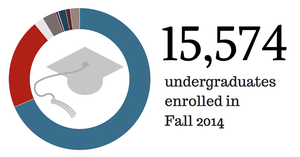
With that redesign, the Office for Campus Diversity wanted to showcase the actual demographics of the University, its students, and the Lafayette community.  So, for the first time on University websites, they introduced infographics to visually highlight the demographics information within their site.
Go ahead and check out the "By the Numbers" section of the Office for Campus Diversity website. Because there are accessibility issues with using photos as the primary source of information, we couldn't have just infographics. However, by also including that information as text within the page, it's now accessible for our visually impaired users, and gives Google an opportunity to scrape that information for search results. For those who don't have a visual impairment, the text doesn't detract from the information highlighted in the infographics.
If you're up for it (and have data to showcase), you can create your own infographics using Canva. With Canva, you can also create flyers, presentations, posters, and invitations. Just make sure you use the approved web colors.
Congratulations, Office for Campus Diversity, for being such trailblazers!